Section 7 Prediction
In this section, we move to our next social science goal
- Describe
- Explain, evaluate, and recommend \(\rightarrow\) Causality
- Predict
- Discover
Most of the tools we have been working on thus far have focused on first describing our data and then conducting tests through different types of comparisons and visualizations, in order to assess a deductive hypothesis, explaining the relationship between two variables.
Now we turn to a different goal.
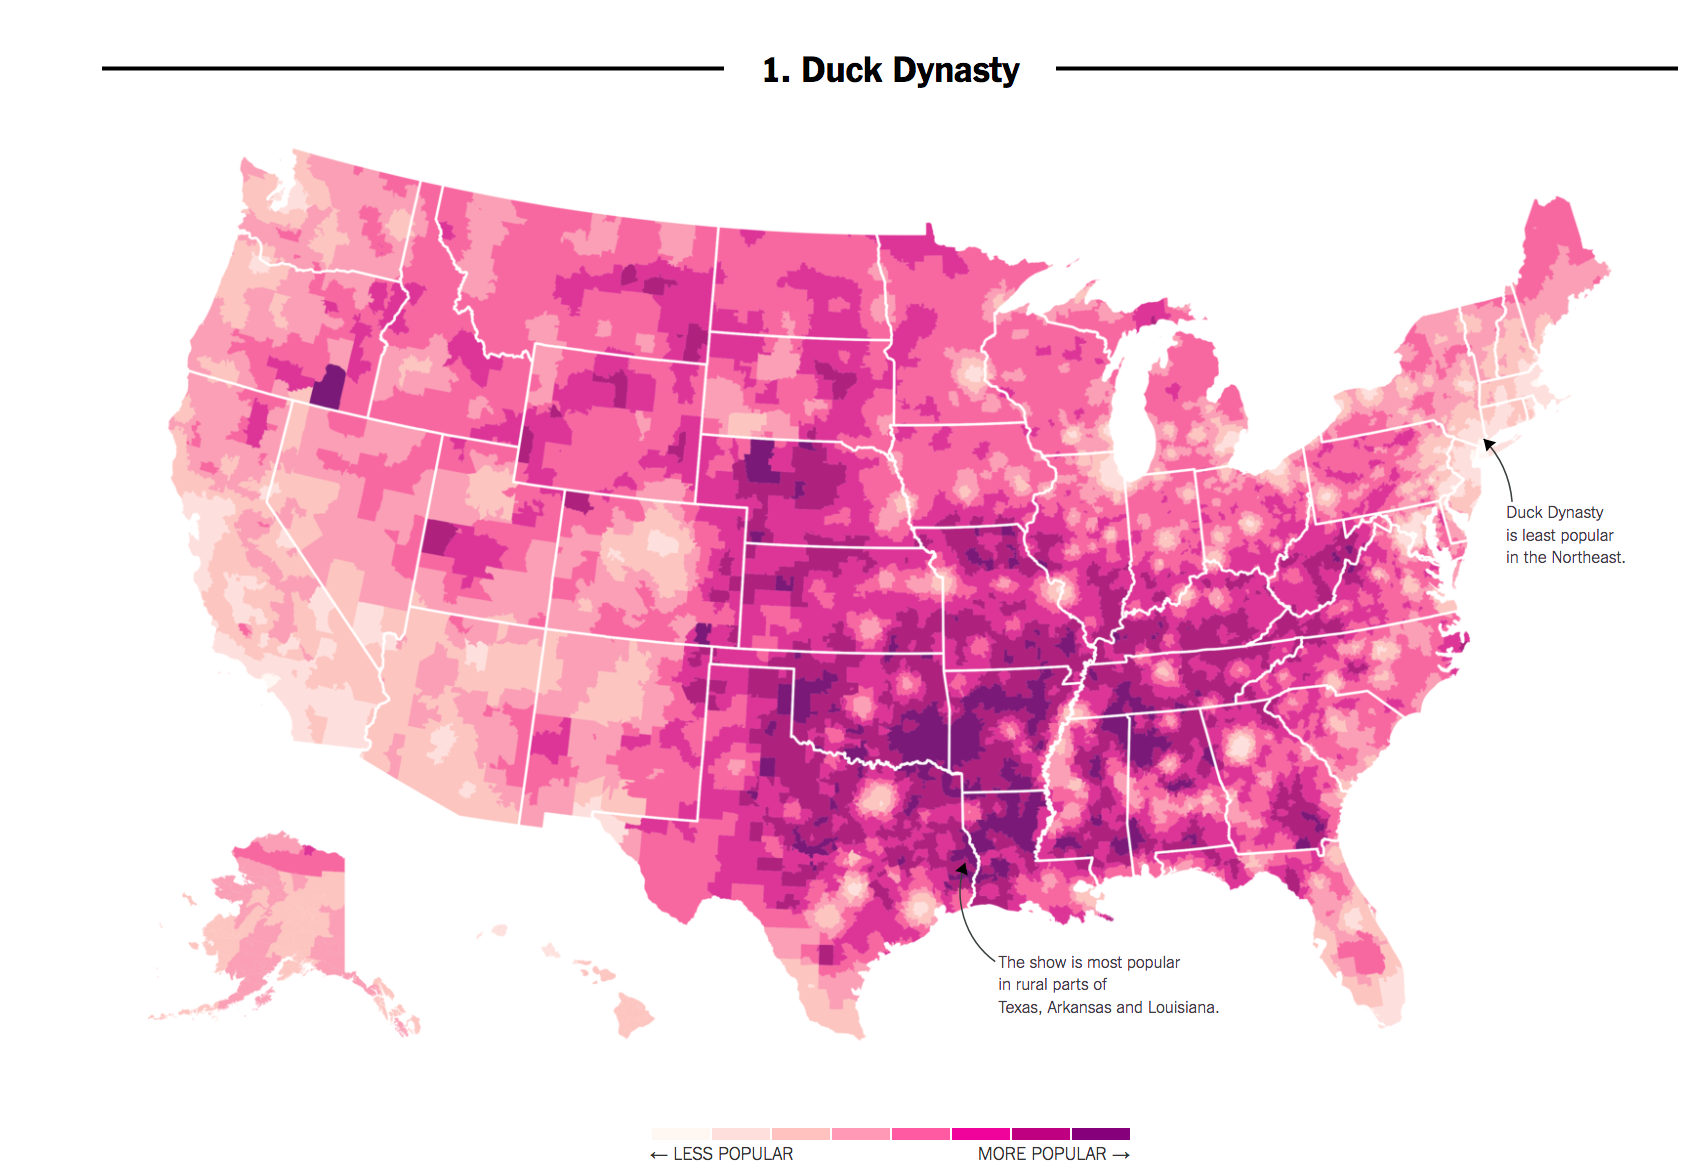
Recall the difference between Correlation vs. Causality using our graphic showing the popularity of Duck Dynasty in different parts of the country. In 2016, researchers at the NY Times noticed that areas in the country where the television show Duck Dynasty was popular also tended to support Donald Trump at higher rates.
For those used to working with the goal of explanation, shifting to prediction and classification may mean we need to shift what types of information we think is important.
- Correlation: Areas that watch Duck Dynasty are more likely to support Trump (degree to which two variables ``move together”)
- Causality: Watching Duck Dynasty (vs. not watching) causes you to support Trump.
If we were interested in the goal of explaining voting decisions (what causes someone to vote a certain way?), we might not care if someone watches the show. However, if we were just interested in predicting vote share or voting decisions, a strong correlation could still be useful. Without spending a single dollar on surveying a community, we might have a general sense of their support for a candidate.