12.5 Application: Voter Identification Laws
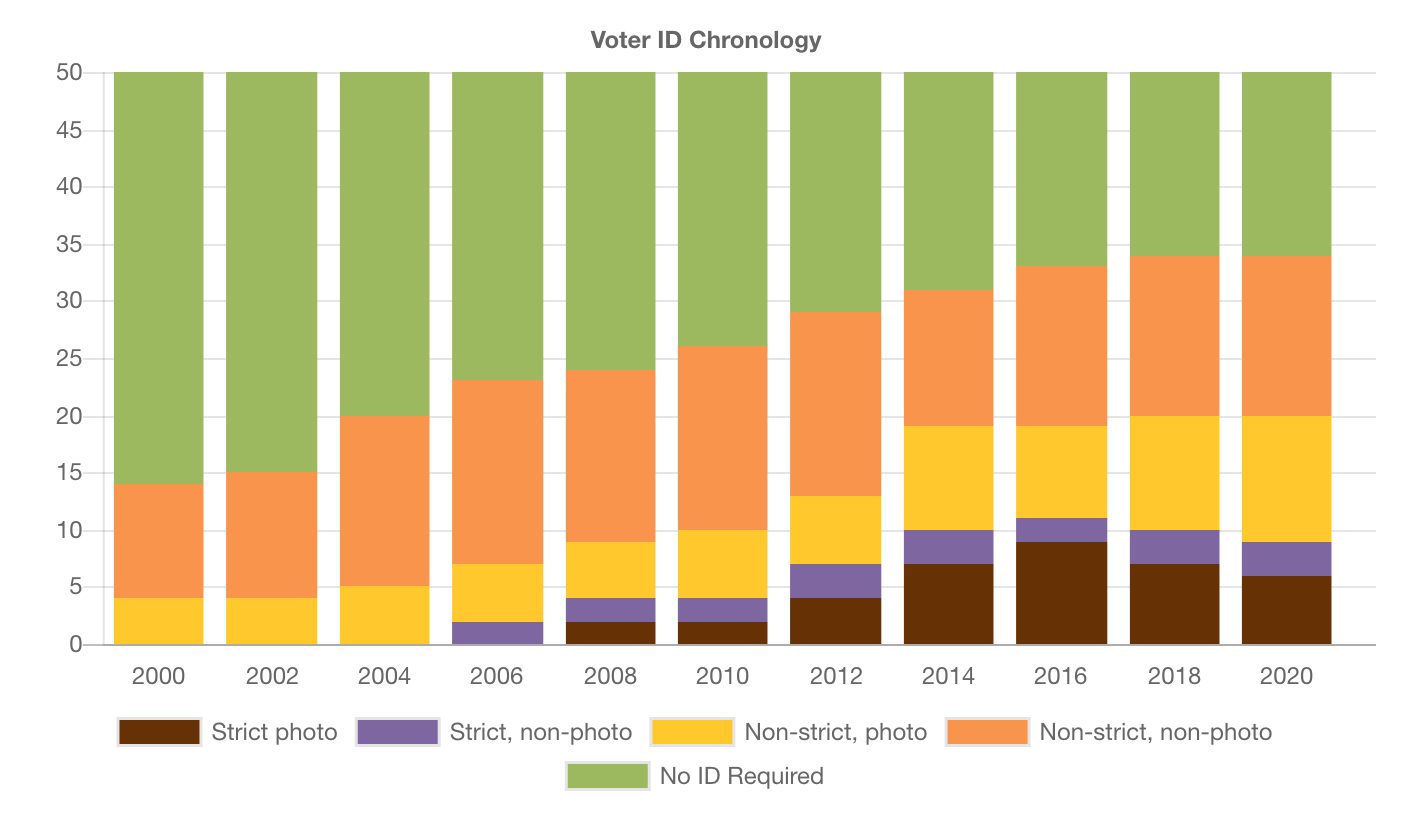
According to the NCSL, 35 states have laws requesting or requiring voters to show some form of identification at the polls.
- The presence of voter ID laws and the strictness of these laws has accelerated over the past decade.
- We will look at the geography of these laws to see if there are regional or other political patterns to these
NCSL
12.5.1 Using the %in% function
Detecting if something is contained within a vector: The function %in% asks: is this contained in the vector? Yes/No
"new jersey" %in% c("new jersey", "california", "nebraska")## [1] TRUE"florida" %in% c("new jersey", "california", "nebraska")## [1] FALSE(! "florida" %in% c("new jersey", "california", "nebraska")) # not in## [1] TRUEWe will augment our map data with a new variable that classifies states according to their voter ID laws.
usmap <- map_data("state")

head(usmap)
## long lat group order region subregion
## 1 -87.46201 30.38968 1 1 alabama <NA>
## 2 -87.48493 30.37249 1 2 alabama <NA>
## 3 -87.52503 30.37249 1 3 alabama <NA>
## 4 -87.53076 30.33239 1 4 alabama <NA>
## 5 -87.57087 30.32665 1 5 alabama <NA>
## 6 -87.58806 30.32665 1 6 alabama <NA>## create variable as NA
usmap$photoidlaws <- NA
## Fill in vaariable with state categories
usmap$photoidlaws[usmap$region %in% c("arkansas","georgia", "indiana", "kansas","mississippi", "tennessee", "wisconsin")] <- "Strict Photo ID"
usmap$photoidlaws[usmap$region %in% c("alabama", "florida", "idaho", "louisiana",
"michigan", "montana", "rhode island", "south carolina",
"south dakota", "texas")] <- "Non-Strict Photo ID"
usmap$photoidlaws[usmap$region %in% c("arizona", "north dakota",
"ohio", "wyoming")]<- "Strict Non-Photo ID"
usmap$photoidlaws[usmap$region %in% c("alaska", "colorado", "connecticut",
"delaware", "hawaii", "iowa", "kentucky", "missouri",
"new hampshire", "oklahoma", "utah", "virginia",
"washington", "west virginia")] <- "Non-Strict Non-Photo ID"
usmap$photoidlaws[usmap$region %in% c("oregon", "nevada","california",
"new mexico", "nebraska", "minnesota",
"illinois", "north carolina", "pennsylvania",
"new york", "new jersey", "massachusetts",
"vermont", "maryland", "north carolina",
"district of columbia",
"maine")] <- "No Document Required"
## Make it a factor categorical variable
usmap$photoidlaws <- as.factor(usmap$photoidlaws)Let’s create a map of the U.S. We will then annotate the map with information about voter identification laws.
ggplot()+
  geom_polygon(data=usmap, aes(x=long, y=lat, group=group,
                               fill=photoidlaws),
               colour="black")+
  ## palette lets you pick a color scheme without specifics
  scale_fill_brewer(palette="Greens", name="Photo ID Laws")+

  theme_void() +
  ggtitle("Map of U.S. Voter ID Laws")+
  coord_quickmap()