7.4 Example: Using polls to predict the 2020 election results
For a video explainer of the code for this application, see below. (Via youtube, you can speed up the playback to 1.5 or 2x speed.)
Many forecasters use pre-election polls in their models to predict election outcomes. In 2016 and 2020, polling-based forecasts received a lot of criticism
Prior to the 2016 elections, forecasts that used polls seemed confident that Hillary Clinton would win the election. Political analysts also seemed to think the polls were favorable to Clinton.
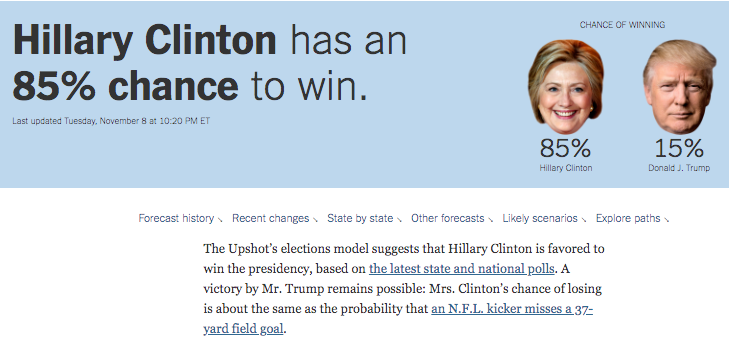
NY Upshot
We all know that afterwards, Clinton did not win.
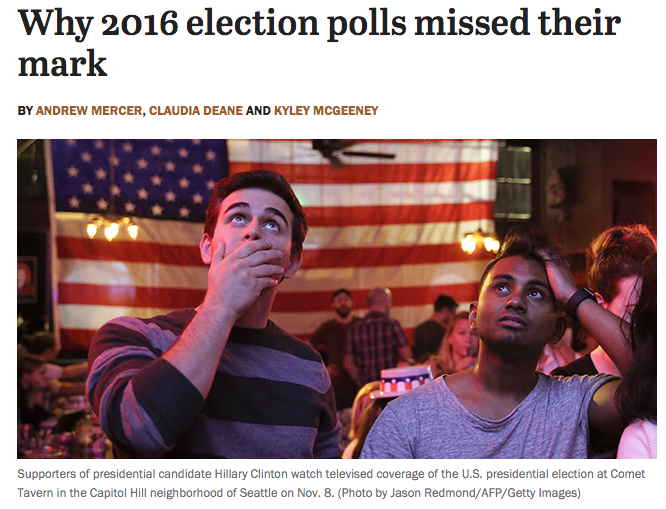
Pew
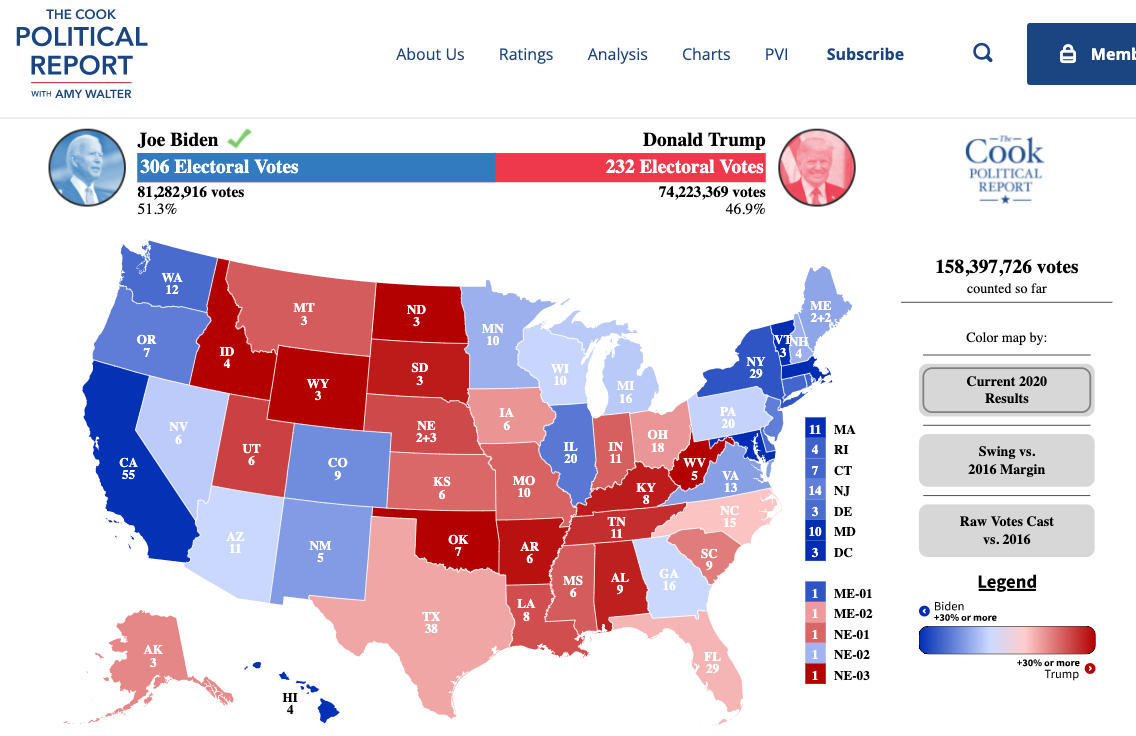
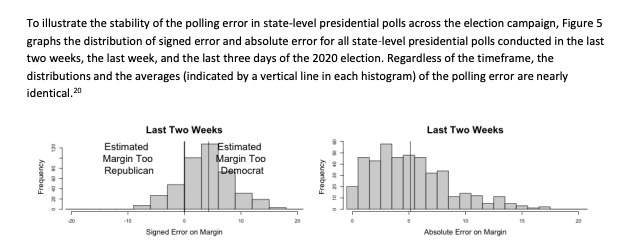
This led public opinion scholars and practitioners to do a deep investigation into the quality of pre-election polling. Like 2016, following the 2020 election, a similar team investigated the quality of pre-election polling in 2020. Here, while many polls pointed to a favorable outcome for Biden, the results seemed closer than one might have anticipated.

The results of these findings are in the AAPOR report.
7.4.1 Choose an approach: Let’s analyze some polls
We are going to do our own analysis of pre-election polls as a prediction of the 2020 election results. We will use a large number of state polls conducted from May-November 2020 that were made available to the public on FiveThirtyEight.
polls2020 <- read.csv("pollsandresults2020.csv", stringsAsFactors = T)Variables
TrumpPoll, BidenPoll: Poll-based vote share for Biden or TrumpTrumpResult, BidenResult: Actual vote share for Biden or TrumpEV: Electoral votes associated with state/CDdays_to_election: Days until Election Daystateid: state abbreviationfte_grade: FiveThirtyEight Pollster gradesample_size: Poll sample size
Can we predict the outcome of an election using polls?
Let’s create our outcome variables.
## Biden's margin of victory (or defeat) in  the polls
polls2020$polldiff <- polls2020$BidenPoll - polls2020$TrumpPoll

## Biden's margin of victory (or defeat) in the actual election result
polls2020$resultdiff <- polls2020$BidenResult - polls2020$TrumpResult
Positive numbers mean Biden was ahead/won. Negative mean Trump was ahead/won.
Let’s predict the amount of electoral votes for Biden based on polls in each state close to Election Day.
Let’s start with 1 state.
- Let’s grab all polls within 2 weeks of the election or the most recent day polled (for areas that did not have recent polls)
## Iteration vector
states <- unique(polls2020$stateid)
states[1]
## [1] AL
## 55 Levels: AK AL AR AZ CA CO CT DC DE FL GA HI IA ID IL IN KS KY LA MA ... WY## Subset to just Alabama
subdata <- subset(polls2020, stateid == states[1])
## Further subset to the "latest polls"
subdata <- subset(subdata, days_to_election < 15 |
days_to_election == min(subdata$days_to_election) )Now let’s extract the actual margin for Biden, the poll-based predicted margin, and finally, let’s assign electoral votes based on our prediction.
## Find the margin for the actual result
result.marginAL <- mean(subdata$resultdiff)
result.marginAL
## [1] -25.4## Find the margin for our prediction
polls.marginAL <- mean(subdata$polldiff)
polls.marginAL## [1] -21.16667## Allocate votes for Biden according to the margin
bidenvotesAL <- ifelse(mean(subdata$polldiff) > 0,
unique(subdata$EV), 0)
bidenvotesAL## [1] 0We predicted Biden would lose Alabama because the polls.marginAL is negative. Therefore, we assigned Biden 0 electoral votes in this example.
7.4.2 Loop through all states
## Iteration vector
states <- unique(polls2020$stateid)
## Container vector
polls.margin <- result.margin <- bidenvotes <-
  rep(NA, length(states))

names(polls.margin) <- names(result.margin) <-
  names(bidenvotes)  <-as.character(unique(states))

## Loop
for(i in 1:length(states)){
  subdata <- subset(polls2020, stateid == states[i] )
  subdata <- subset(subdata, days_to_election < 15 |
                      days_to_election == min(subdata$days_to_election) )
  result.margin[i] <- mean(subdata$resultdiff)
  polls.margin[i] <- mean(subdata$polldiff)
  bidenvotes[i] <- ifelse(mean(subdata$polldiff) > 0,
                            unique(subdata$EV), 0)
 }
sum(bidenvotes) # predicted
## [1] 3517.4.3 Check Accuracy
7.4.3.1 Quantitative Measures of Accuracy
Let’s calculate two common measures of prediction error: bias (the average prediction error) and root-mean-squared error (a typical magnitude of the prediction error).
## Calculate Bias (Predicted Biden - True Biden)
predictionerror <- polls.margin -result.margin
bias <- mean(predictionerror)

## Root Mean Squared Error
sqrt(mean((predictionerror)^2))
## [1] 6.052873On average, the poll-based prediction was more than 4 points larger for Biden’s margin than the actual result.
We can create a plot similar to the left plot from the AAPOR report.
## Histogram of Prediction Errors to Show Bias
hist(predictionerror,
     xlab = "Prediction Error (Predicted Biden Margin - Actual)",
     main = "Histogram of Prediction Error in Latest Polls")
abline(v=mean(predictionerror), col="red")
abline(v=0)
Another way to visualize the prediction error
- Let’s create our own version of this AAPOR Plot

We will plot the prediction error on the x-axis, and list the corresponding states on the y-axis.
- We will sort the prediction error to make it easier to see the pattern of results.
plot(x=sort(predictionerror), y=1:length(predictionerror),
     main="Average Prediction Error by State \n Biden - Trump Margin",
     ylab="State",
     xlab="Prediction Error (Predicted Biden Margin - Actual Margin)",
     yaxt="n",
     bty="n",
     xlim = c(-5, 15))
abline(v=0, lty=2)
axis(2, 1:length(predictionerror), labels=names(sort(predictionerror)), las=1,
     cex.axis=.5,tick=F)
axis(1, seq(-5, 15, 5), seq(-5, 15, 5))
text(-3, 15, "Poll Margin \n Skewed Toward Trump", cex=.7)
text(8, 15, "Poll Margin \n Skewed Toward Biden", cex=.7)
7.4.3.2 Classification
Instead of quantifying how far we were off, let’s see where we were right vs. where we were wrong.
Classification
- true positive: correctly predicting Biden to be the winner
- false positive: incorrectly predicting Biden to be the winner
- true negative: correctly predicting Biden to be the loser
- false negative: incorrectly predicting Biden to be the loser
Confusion Matrix
Let’s classify our predictions.
actualwins <- ifelse(result.margin > 0, "Biden Won", "Trump Won")
predictedwins <- ifelse(polls.margin > 0, "Biden Won", "Trump Won")table(predictedwins, actualwins)## actualwins
## predictedwins Biden Won Trump Won
## Biden Won 28 3
## Trump Won 0 24Where did the polls get it wrong?
actualwins[actualwins != predictedwins]## FL ME2 NC
## "Trump Won" "Trump Won" "Trump Won"What’s your conclusion?
- Are the polls alright?
- How could you improve the prediction?
- Wait a second… why even poll?