2.3 Functions to summarize univariate data
For univariate data, often we are interested in describing the range of the values and their central tendency.
- range: the minimum (
min()) and maximum (max()) values - mean: the average value (
mean())
The average is the sum of the values divided by the number of values:
\(\bar{X} = \frac{\text{sum of values}}{\text{number of values}} = \frac{x_1 + x_2 + ... + x_N}{N}=\frac{1}{N}\sum_{i=1}^{i=N} x_i\)
Let’s do this in R for our set of 10 values
(0 + 0 + 0 + 0 + 1 + 1 + 0 + 1 + 0 + 1)/10## [1] 0.4The average outcome is .4. Note: when a variable contains only 0’s and 1’s its mean is the proportion of 1’s. 40% of people think the economy is doing well.
2.3.1 Using functions in R (overview)
A function is an action(s) that you request R to perform on an object or set of objects. For example, we will use the mean() function to ask R to take the mean or “average” of a vector.
- Inside the function you place inputs or “arguments.”
mean(Outcome)## [1] 0.4R also has functions that take the sum sum() of a vector of values.
sumofvalues <- sum(Outcome)And that count the total number of values or “length” length() of the vector.
numberofvalues <- length(Outcome)Note that the below is also equivalent to the mean
sumofvalues / numberofvalues## [1] 0.4Returning to our example, we found that 40% of people surveyed thought the economy was doing well. Surveying people about their opinions on how the country doing is a common way that social scientists use description. We could extend this exercise in many ways going forward, even with the same question.
- Start with a question: How is the economy doing?
- Let’s find a measure: Ask people if the economy is doing well.
- Find data points: Multiple people (we could stop there with the average!), or add more variables:
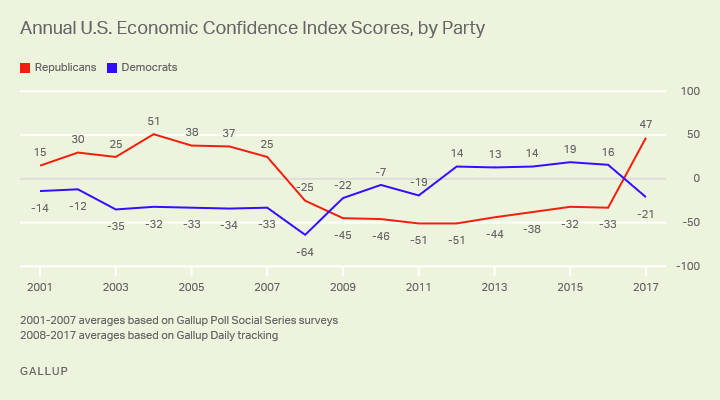
- Across time: Survey people across multiple years
- Across type of people: Survey different partisan groups
These types of survey trends are often used by news organizations and public opinion organizations like, Gallup.
This was just a first example of description in political science. There are many other ways to describe how the economy is doing and many other topics we might want to describe in politics.