7.3 Example: Forecasting 2020 US Election based on 2016 Results
Let’s try to predict the 2020 election results using just the 2016 results.
For a video explainer of the code for this application, see below. (Via youtube, you can speed up the playback to 1.5 or 2x speed.)
results2020 <- read.csv("elecresults2020.csv", stringsAsFactors = T)Variables
state: state or state and districtcalled: result of 2020 electionmargin2016: two-party margin in 2016. Positive values indicate Democratic win, negative indicate Republican winEV: Electoral votes associated with a state/ district of a state
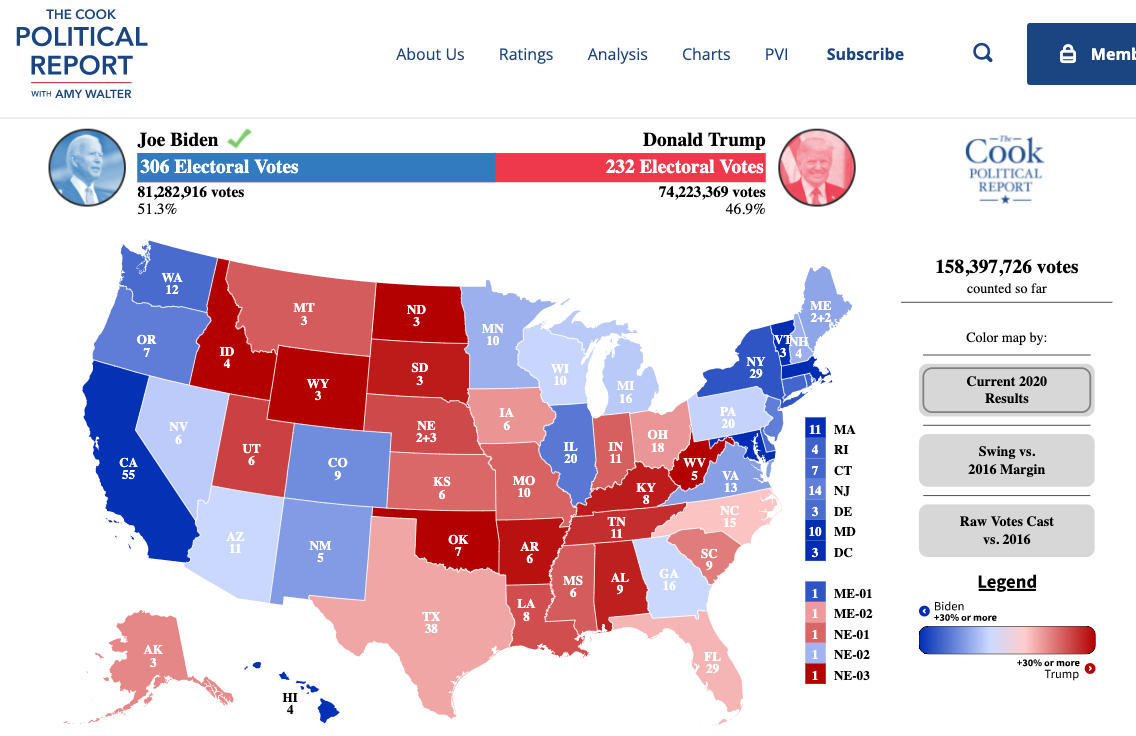
sum(results2020$EV[results2020$called == "R"])## [1] 232sum(results2020$EV[results2020$called == "D"])## [1] 3067.3.1 Choose Approach
- Choose an approach: Using an observed (known) measure as a direct proxy to predict an outcome
- Let’s use the 2016 result as a direct proxy to predict 2020.
results2020$predicted2020 <- ifelse(results2020$margin2016 < 0, "R", "D")
results2020$predicted2020 <- as.factor(results2020$predicted2020)
7.3.2 Assess Accuracy
- Assess accuracy
What proportion of states did we get correct?
mean(results2020$predicted2020 == results2020$called)## [1] 0.8928571Classification
We want to correctly predict the winner of each state
Prediction of binary outcome variable = classification problem
- true positive: correctly predicting Biden to be the winner
- false positive: incorrectly predicting Biden to be the winner (misclassification)
- true negative: correctly predicting Biden to be the loser
- false negative: incorrectly predicting Biden to be the loser (misclassification)
We define one outcome as the “positive” and one as the “negative.” Here we will say a Biden win is the positive and a Trump win is the negative. You could flip this and make a Trump win the positive and a Biden win the negative. This terminology comes from settings where there is a more objective positive vs. negative result (e.g., a positive medical test result) than most social science settings. The key thing is that we are trying to identify different types of correct classifications vs. misclassifications.
Confusion Matrix: Tells us how we went right, how we went wrong.
table(predicted=results2020$predicted2020, actual = results2020$called)## actual
## predicted D R
## D 22 0
## R 6 28Which states did we get wrong?
results2020$state[results2020$predicted2020 != results2020$called]## [1] Arizona Georgia Michigan
## [4] Nebraska 2nd District Pennsylvania Wisconsin
## 56 Levels: Alabama Alaska Arizona Arkansas California Colorado ... Wyoming7.3.3 Iterate to improve predictions
Start back at step one. We continue to repeat steps 1 and 2 until we are confident in our predictions.
How could we improve our predictions of elections? What other information could we use?