2.5 Comparing VEP and VAP turnout
2.5.1 Creating new variables in R
Let’s create a new variable that is VAP that adds overseas voters.
# Use $ to add a new variable (i.e., column) to a dataframe
turnout$VAPplusoverseas <- turnout$VAP + turnout$overseas
Under the hood, what this is doing is taking each value of turnout$VAP and adding it to its corresponding values of turnout$overseas.
And, yes, this new variable shows up as a new column in turnout. Go ahead, View() it
View(turnout)This does not change the underlying turnout.csv file, only the turnout data.frame we are working with in the current R session.
- This is an advantage of using an R script.
- You don’t have to worry about overwriting/messing up the raw data.
- You start from the original raw data when you load
turnout.csv, and then everything else is done within R.
This is our new denominator. Now we can calculate turnout based on this denominator.
turnout$newVAPturnout <- turnout$total / turnout$VAPplusoverseasJust like with adding two vectors, when we divide, each value in the first vector is divided by its corresponding value in the second vector.
turnout$newVAPturnout## [1] 0.5203972 0.4024522 0.5253748 0.3607845 0.4972260 0.3593884 0.5404097
## [8] 0.3803086 0.4753376 0.3483169 0.4934211 0.3582850 0.5454777 0.5567409Let’s calculate the VEP turnout rate and turn it into a percentage. This time, we do it in one step.
- (total votes / VEP) \(\times\) 100:
turnout$newVEPturnout <- (turnout$total / turnout$VEP) * 100
turnout$newVEPturnout
## [1] 54.19551 42.13701 55.24860 38.14115 52.76848 38.41895 58.11384 41.12625
## [9] 51.65793 38.09316 54.22449 39.51064 60.10084 61.55433Let’s change it from a proportion to a percentage. How? Multiply each value of turnout$newVAP by 100
turnout$newVAPturnout <- turnout$newVAPturnout * 100This multiplies each number within the vector by 100.
turnout$newVAPturnout## [1] 52.03972 40.24522 52.53748 36.07845 49.72260 35.93884 54.04097 38.03086
## [9] 47.53376 34.83169 49.34211 35.82850 54.54777 55.67409What is typical turnout?
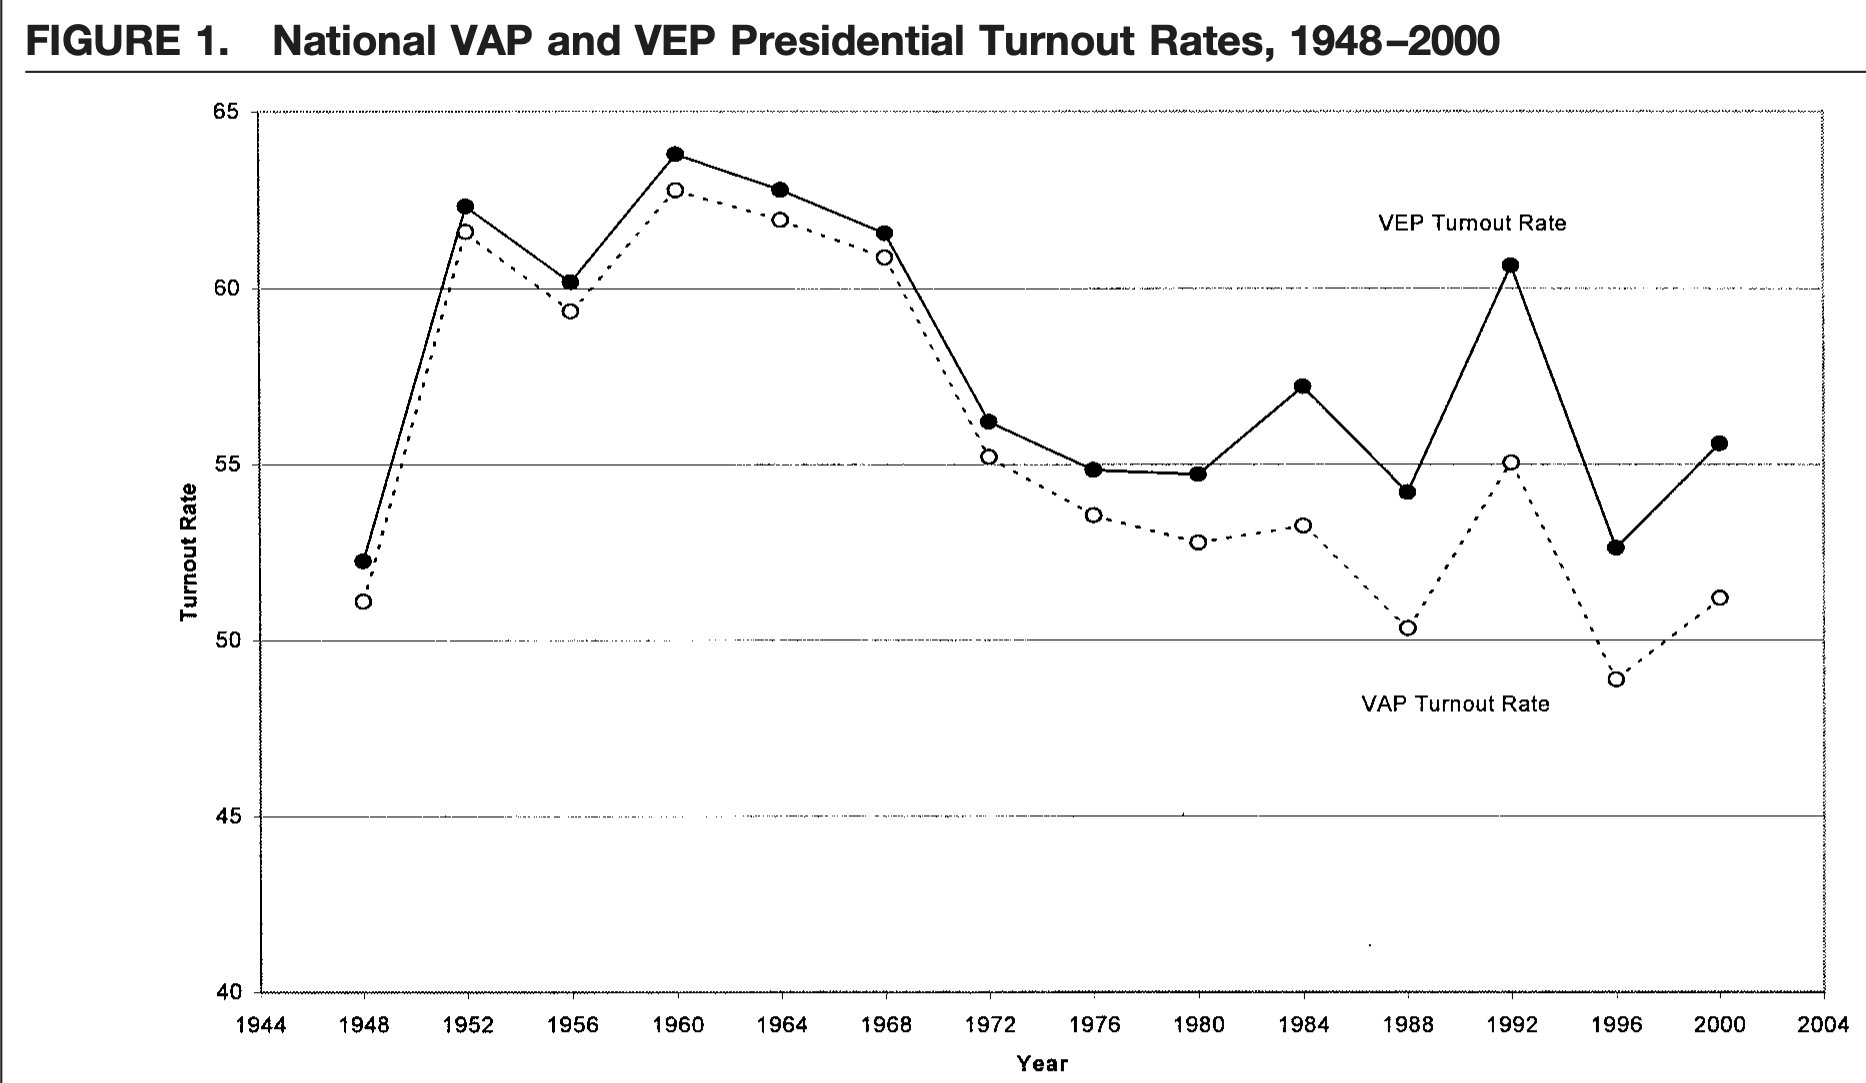
mean(turnout$newVAPturnout)## [1] 45.45658mean(turnout$newVEPturnout)## [1] 48.94937We find that turnout based on the voting age population is lower than turnout based on the voting eligible population. This is a pattern that political scientists have examined, going back several decades. For example, in a 2001 article McDonald and Popkin show that is it the ineligible population that grew from the 1970s onward and not the population of people who simply prefer not to vote. (See more here.)
McDonald and Popkin 2001