13.1 What’s the fuss?
Let’s first discuss why we might even want special methods for analyzing survey data in the first place.
When you have survey data, oftentimes as researchers are interested in making inferences from a sample available in the survey to a broader population. However, there may be many ways in which our sample is not representative of the population. The represenativeness of a survey is one component of what is called the “total survey error” framework.
- Matt Salganik’s book Bit by Bit describes this in section 3.3
In the ideal case, we would draw a simple random sample from the population using probability sampling.
- Sample n units from an N population where each unit has equal probability of being sampled. We can get sample statistics very simply in this case.
- For example, the simple mean of a variable measured in the sample would be equivalent to the expected value in the population.
\[\begin{align*} \bar y &= \frac{1}{n}\sum_{i=1}^n y_i\\ \mathbf E(\bar y) &= \mu \end{align*}\]
In this estimator, we assume that all sample units \(i\) represent the same number of units in the population. When could this go wrong? Basically, almost any time we actually try to sample from a population in practice. It is very, very hard to get simple random samples of the population.
Sometimes the way survey samples are collected are through complex designs. Example:
Stratified sample of the United States
- Consider each county a “strata”
- Conduct a random sample within strata
- Why? If you conduct a simple random sample at the individual-level, just by chance you might not not sample within each county
Clustered random sample within the United States
- Consider each county
- Sample \(m\) number of counties (these are considered to be “clusters”)
- Sample within each cluster
When you have generated a sample using cluster or stratified sampling, it is best to account for this data generating process in the analysis to get accurate estimates for sample averages and variances. The R package we will use will account for this.
13.1.1 Weighting Surveys
In many cases, our survey data are not perfectly representative of the population. In these cases, often a researcher might want to employ weights to adjust the estimates calculated from a sample in order to make them more accurate for the population of interest.
- What was the problem: Each unit \(i\) in the sample no longer represents the same number of units in the cluster, strata, or population. Some types of people might be “overrepresented” in the sample relative to the population, and some might be underrepresented.
- One Solution: Weights \(w\) to reflect/ adjust for the number of units in the population that the sampled unit \(i\) represents.
- What do we need? Auxiliary information about the target population so we know how to adjust the data
- Where do we get this? Sometimes it is provided by survey firms or described in the codebook of existing surveys. Other times, you could consider constructing your own weights.
Example: \[\begin{align*} \bar y &= \sum_{i=1}^n y_i*w_i\\ \end{align*}\]
When will weights matter?
- Weights will matter particularly when your data are unrepresentative on characteristics that directly influence your outcomes of interest.
- For example, let’s say you had a survey that was representative except for age. You had too many young people in the sample relative to the population. Let’s say you are interested in predicting the proportion of people who voted for Biden in 2020. If age did not matter for vote choice, then it might not matter that your survey was unrepresentative by age. But, if age does matter, then the unweighted estimate from your sample might be biased!
Where can weights go wrong?
- Let’s be real here. Weighting is an art as much or more than a science.
- It is not always immediately obvious what the target population is (e.g., if the target population is the set of people who will vote in an election).
- It is not always immediately obvious how to get accurate data on this target population, even if known (e.g., not every population as up-to-date Census information).
- It is not always obvious which variables to choose to weight on (e.g., which demographics?)
- You may also not have all variables of interest available in your sample or at the population level.
- Missing cells. Even if you have all of the above, weighting can still be insufficient if your sample simply does not contain certain subgroups of the population or contains too few members of a certain subgroup of the population. (e.g., suppose your sample only includes 18-25 year olds – it will be hard to infer things about older populations.)
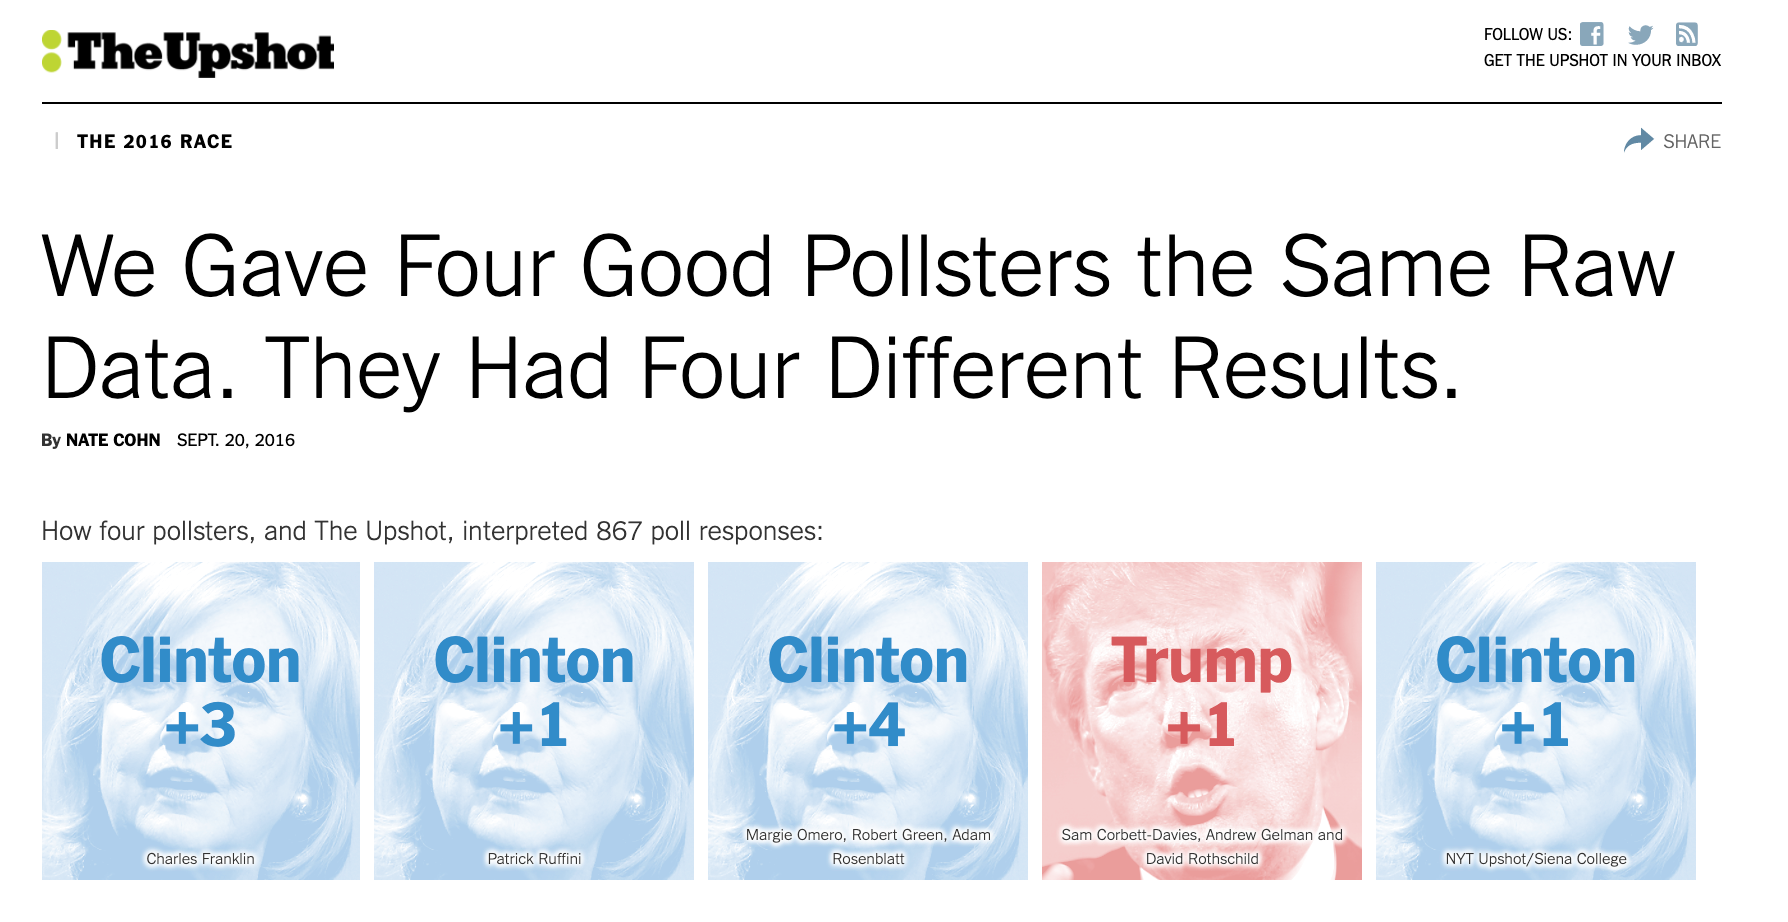
For example, The Upshot gave different polling firms the same survey data. They each came up with different estimates of vote choice in 2016 due to small differences in choices about weighting and identifying the target population.The linked article describes the different choices the pollsters likely made.
13.1.2 Broad Types of Survey Sampling Techniques
Survey sampling techniques are sometimes broken into two types: non-probability and probability sampling.
In probability samples, the probability that a respondent is selected for the survey is known, and this helps ensure that the sample will be representative. However, what is becoming increasingly less known, is the probability that a person will respond to a survey. Because this is less well-known, even probability samples will need adjustments for weighting to get accurate estimates.
Non-probability samples come in many different forms, such as those that use “quota sampling,” convenience samples from online labor markets, or more sophisticated algorithms for choosing respondents that reflect the population. Pew describes different types of non-probability samples here.
Matt Salganik, as part of the curriculum for the Summer Institutes in Computational Social Science, provides a nice overview of the tradeoffs between probability and non-probability samples and what this means for survey weighting.
Pew provides a somewhat more pessimistic take on nonprobability samples in this report.